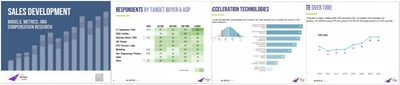

The state of Sales Development in B2B.
Matt Bertuzzi · The Bridge Group · Published Feb 6, 2025 · 351 B2B companies
|
60%
Reps at quota
Lowest on record |
$80K
Median SDR OTE
0.56% CAGR over decade |
$3.78M
Pipeline per SDR
↑ sharply from $2.83M |
3.0 mo
Avg. ramp time
Lowest since 2010 |
Key findings, 2025
The following findings are drawn from survey responses from 351 B2B companies. 78% are North America-based, 83% are B2B SaaS, with a median revenue of $47M and median ASP of $50K. All figures are medians or averages as noted. Full methodology is described below.
| Metric | 2025 finding | Context |
|---|---|---|
| Share of SDRs at quota | 60% Lowest reported in study history | This metric has trended down since 2018. The majority of companies (67%) report 50–89% of reps at quota; 21% report 70–89%. |
| Median SDR on-target earnings | $80K Unchanged since 2022 | 68:32 base-to-variable split ($55K base / $25K variable). OTE has grown at just 0.56% CAGR nominally over the past decade — well below inflation (CPI grew 43.9% over 14 years). |
| Pipeline sourced per SDR | $3.78M ↑ from $2.83M in 2022 | Raw pipeline, not forecast or closed-won. 50% of respondents report between $1.9M and $6.4M per SDR annually. The increase reflects higher ASPs ($44K median in 2024 vs. $27K in 2022) rather than more meetings. |
| Monthly quota — Stage 0 held | 10 (global median) ↓ 40% since 2018 | Introductory model: 16.0. Semi-qualified: 10.4. Fully qualified: 9.0. Stage 1 Converted global median is 6, down 43% since 2018. Quotas remained rock-steady from 2022 to 2024. |
| Average ramp time | 3.0 mo Lowest since 2010 | Down from a peak of 3.8 months in 2014. May reflect AI-powered onboarding or tightening management expectations on time-to-productivity. |
| Average SDR tenure | 1.9 yrs Highest since early 2010s | Rebounded sharply, driven by 2022–2023 layoffs and a competitive AE job market in 2024 reducing voluntary churn. 58% of companies report 12–23 month average tenure. |
| Annual attrition (2024) | 40% median 25th–75th percentile: 21%–57% | Involuntary: 13%. Voluntary: 11%. Promotions: 16%. Promotions have halved since the post-COVID boom (34% in 2020). Median turnover of 40% reflects a stabilizing labor market. |
| SDR-to-AE ratio | 1 SDR : 2.4 AEs Consistent since 2018 | Most common model: 1 SDR to 2 AEs (31%). Smaller companies deploy more SDRs per AE. 2025 marks the first year "AI SDRs" appeared as a distinct category (1% of respondents). |
| SDR alignment to AE territories | 82% ↑ from 56% in 2018 | Trend has increased consistently over time and persists across revenue bands and ASP. Just 40% of inbound-only teams align SDRs to AE territories. |
| Daily activity — Quality Conversations | 4.1 QCs/day First rebound in study history | Median total daily activities: 112 (44 phone, 41 email, 19 LinkedIn, 8 text/other). Phone-centric teams average 56 dials and 4.6 QCs per day vs. email-centric teams at 28 dials and 3.4 QCs. |
| SDR reporting structure | 60% report to Sales Consistent since 2012 | 26% report to Marketing; 10% to CxO. Experience and interest remain the dominant factors in determining reporting structure over org design principles. |
| Rep-to-leader ratio | 6.4 SDRs per leader ↓ from 8 in 2021–2023 | 43% of companies have 7–9 SDRs per first-line leader. Ratio rises with company size: 3.6 at sub-$5M revenue vs. 8.1 at $500M+. |
| SDR manager OTE | $146K ↑ from $127K in 2018 | Director OTE: $189K (down from $193K in 2022 — first negative growth on record). VP OTE: $240K (down from $243K). Manager compensation growing; Director and VP OTEs declining. |
Cite this research
When referencing this report in published work, please use the following citation. The URL below is the stable canonical reference for this edition.
Bertuzzi, M. (2025). Sales Development Models, Metrics & Compensation: 2025 Research Report (10th ed.). The Bridge Group. https://www.bridgegroupinc.com/research/2025-sdr-models-metrics-report-the-bridge-group
Download the full report: blog.bridgegroupinc.com/sales-development-metrics
About the research
The Sales Development Models, Metrics & Compensation study has been conducted biennially since 2007. The 2025 edition is the 10th in the series. The study is designed to provide B2B revenue leaders with practical benchmarks on the structure, compensation, activity metrics, and performance of the Sales Development Representative role.
Report structure
The report is organized into five sections: (1) Organizational Structure, (2) Hiring, Ramp, and Attrition, (3) Metrics and Quota, (4) Compensation, and (5) Sales Leadership. Each section covers current benchmarks alongside longitudinal trend data where available.
Limitations
This is observational survey data, not a controlled experiment. The sample skews toward organizations with engaged sales development leadership, which may not be representative of all B2B companies. Subgroup comparisons should be interpreted as directional rather than definitive. Pipeline figures represent raw pipeline generated, not forecast or closed-won revenue.
Prior editions
The Bridge Group has published SDR benchmarking research biennially since 2007. Each edition is available for download at the links below.
Download the full SDR report
10th edition of our research into the metrics, models, and motions of the Sales Development role. Across 351 B2B companies.