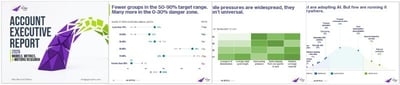

The state of the Account Executive role in B2B sales, 2026.
Matt Bertuzzi · The Bridge Group · Published June 22, 2026 · 158 B2B companies
|
48%
Reps at quota
↓ from 51% in 2024 |
$200K
Median AE OTE
↑ from $190K in 2024 |
$960K
Median AE quota
4.6× quota-to-OTE ratio |
6.2 mo
Avg. ramp time
Highest in study history |
Key findings, 2026
The following findings are drawn from survey responses from 158 B2B companies. All figures are medians or averages as noted. Full methodology is described below.
| Metric | 2026 finding | Context |
|---|---|---|
| Share of reps at quota | 48% ↓ from 51% in 2024 | Distribution has shifted — fewer companies in the 50–90% range; more in the 0–30% danger zone. Long-term trend is downward. |
| Median AE on-target earnings | $200K ↑ from $190K in 2024 | OTE has risen faster than quota over the same period. Median OTE was $167K in 2022. |
| Median AE quota | $960K 4.6× quota-to-OTE ratio | Quota-to-OTE ratio up from 4.2× in 2024. SaaS companies reported a median of $875K; AI-native, services, and physical-goods companies reported higher medians. |
| Ramp time to full productivity | 6.2 mo Highest in study history | Reflects increasing deal complexity and buying committee size, particularly at higher ASPs. |
| Experience required at hire | 3.7 yrs ↑ from 2.7 yrs in 2022 | At higher ASPs, the era of the junior AE appears largely over. Companies are demanding more prior experience as ramp costs rise. |
| AE renewal & expansion ownership | 38% Nearly doubled since 2024 | Share of AEs with sole or blended ownership of renewal and expansion. Role consolidation is most pronounced below $25K ASP. |
| AI adoption — top workflows | Post-call summaries, account research, email personalization | Most common AI-assisted AE workflows. Far fewer organizations use AI across the full AE workflow. Impact ratings remain split — 10 of 11 use cases rated "hit or miss" by a plurality. |
| AI engagement & quota attainment | 57% vs 39% High vs. low AI engagement tercile | Organizations in the highest AI Engagement Score tercile reported 57% of reps at quota, vs. 39% in the lowest. Observational data; groups showed no significant differences across three pre-specified control variables. |
Cite this research
When referencing this report in published work, please use the following citation. The URL below is the stable canonical reference for this edition.
Bertuzzi, M. (2026). AE Models, Motions & Metrics: 2026 Research Report (10th ed.). The Bridge Group. https://www.bridgegroupinc.com/research/2026-ae-models-motions-metrics
About the research
The AE Models, Motions & Metrics study has been conducted biennially since 2006. The 2026 edition is the 10th in the series. The study is designed to provide B2B revenue leaders with practical benchmarks on the structure, compensation, and performance of the Account Executive role.
Limitations
This is observational survey data, not a controlled experiment. Self-selection into AI adoption is real — organizations that invest heavily in AI tools may differ from those that do not in ways not captured in this survey. The sample skews toward organizations with engaged revenue leadership, which may not be representative of all B2B companies. Subgroup comparisons should be interpreted as directional rather than definitive.
Prior editions
The Bridge Group has published AE benchmarking research biennially since 2006. Each edition is available for download at the links below.
Download the full 2026 AE report
2026 edition of our research into the metrics, models, and motions of the Account Executive role. Across 158 B2B companies.